In this tutorial, you will learn the easiest and most efficient way to debug Node.js application code.
So let's get started.
Want to watch the video version of this tutorial? You can check out the video below:
Table Of Contents
- How You Usually Debug Node.js Applications
- How to Add a Debugger to Debug Your Code
- How to Run the Application for Debugging
- How to Access Variables During Debugging
- How to Create a Script to Debug Node.js Apps
- Quick Recap
How You Usually Debug Node.js Applications
If you want to debug a Node.js application, usually you add a console.log statement in the code that you want to debug to find out the value of any variable.
This works, but you need to keep checking the console log to see the value that you're trying to print.
And if the data printed in the console contains nested objects or if it's a lot of data, then using console.log is not feasible.
Fortunately, there's a better way.
How to Add a Debugger to Debug Your Code
Instead, you can add a debugger; statement in the code that you want to debug.
So let's say you have an Express.js API route for registering a user as shown in the below code:
// controllers/auth.js

const register = async (req, res) => {
  try {
    const { email, password } = req.body;
    const existingUser = await User.findOne({
      email,
    });
    if (existingUser) {
      return res.status(400).send('User with the provided email already exist');
    }
    // some more code
    return res.status(201).send();
  } catch (error) {
    console.log(error);
    return res
      .status(500)
      .send('Error while registering a new user. Try again later.');
  }
};

module.exports = { register };

// routes/auth.js
const { register } = require('../controllers/auth');

const Router = express.Router();

Router.post('/api/register', register);
And there's some issue while registering a user, so you want to debug the register function's code.
In that case, you can just add a debugger; statement inside the register function code like this:
const register = async (req, res) => {
  try {
    const { email, password } = req.body;
    debugger;
    const existingUser = await User.findOne({
      email,
    });
    if (existingUser) {
      return res.status(400).send('User with the provided email already exist');
    }
    // some more code
    return res.status(201).send();
  } catch (error) {
    console.log(error);
    return res
      .status(500)
      .send('Error while registering a new user. Try again later.');
  }
};
How to Run the Application for Debugging
Normally, you start your Node.js application by executing the following command:
node index.js
But instead, you can execute the following command:
node inspect index.js
Here, we just added an inspect keyword in between.
If your main application file's name is server.js, you can execute the node inspect server.js command.
Once you execute the above command, you will see the output displayed as shown below:
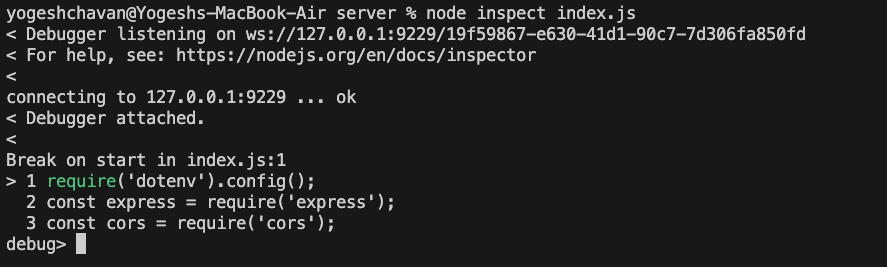
As you can see from the output, the debugger is attached, so now you can start debugging the code.
To do that, open the Chrome browser and enter chrome://inspect in the browser URL.
You will see the output as shown below:
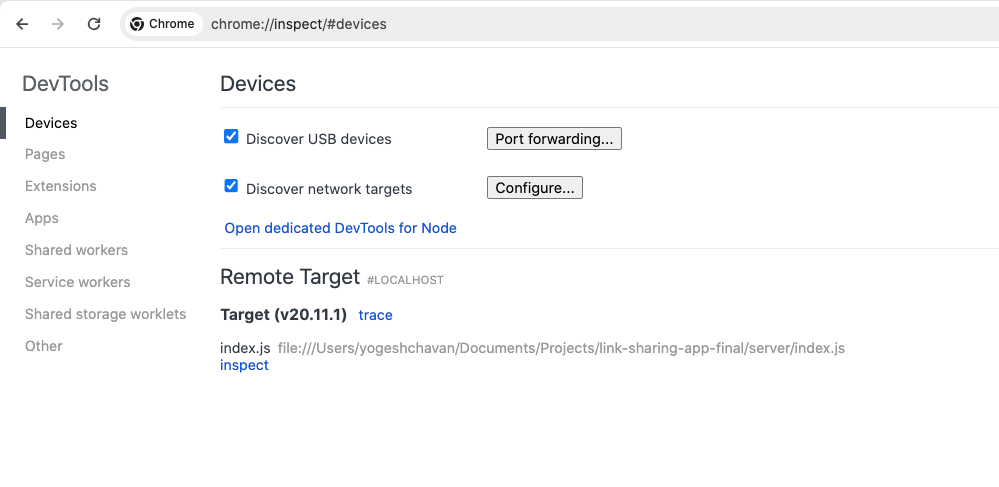
Since you executed the node inspect index.js command to start inspecting, you can see a new target entry displayed under the Remote Target section.
Now, if you click on the displayed blue inspect link, then you will see a new browser dev tool opened as shown below:
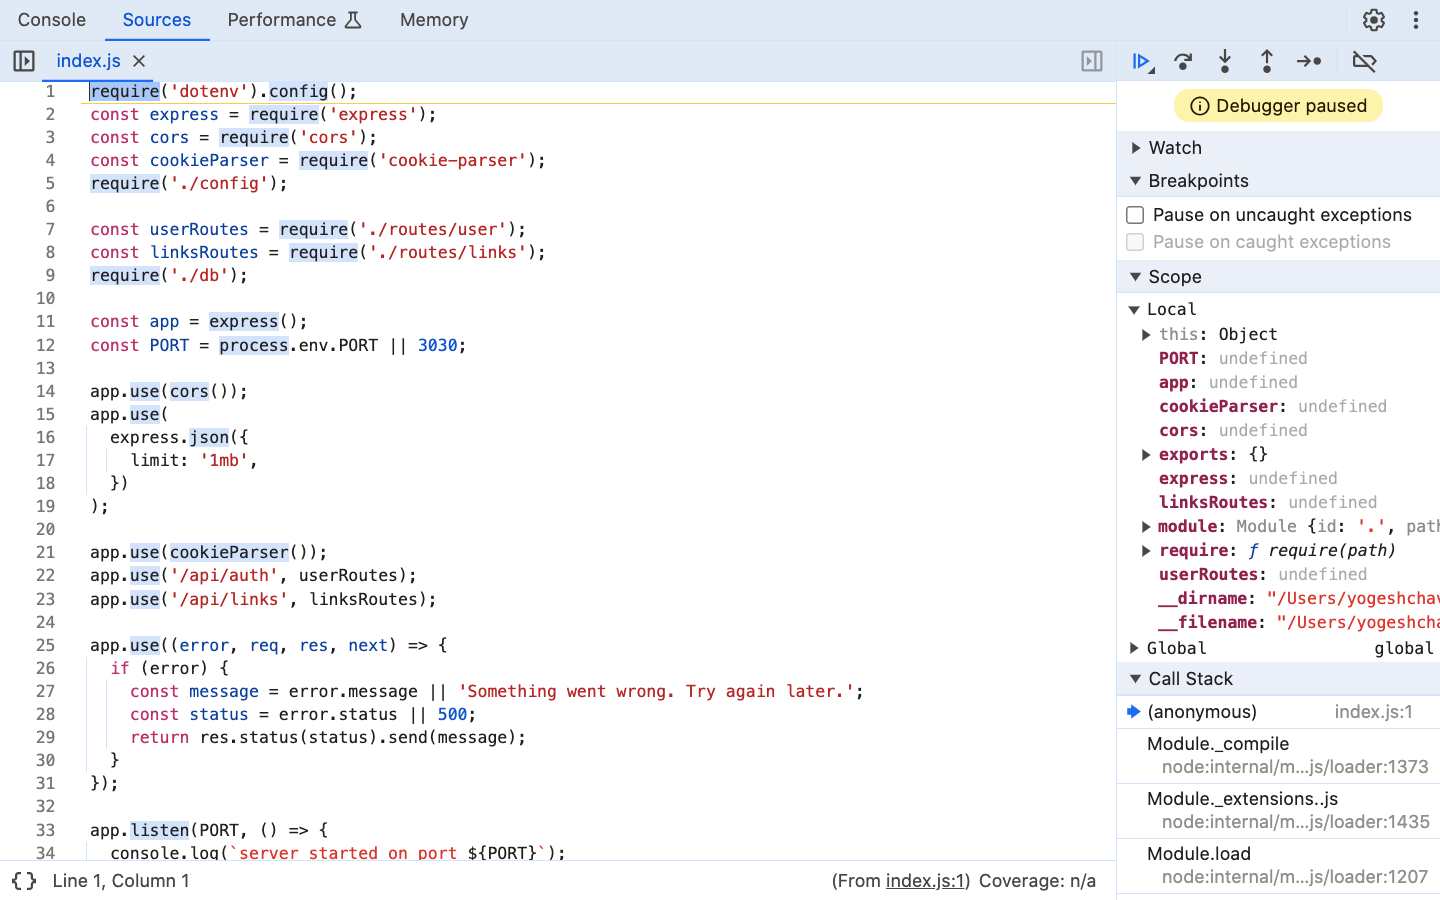
As you can see in the right panel in the above image, the Debugger paused message is displayed. The debugging control is at the first line of code, as you can see from the highlighted yellow line.
But you don't want to start debugging from the first line of code. Instead, you want to just debug the registration code. To do this, click on the blue triangle icon which is displayed just above the Debugger paused message as shown below:
Now don't close this window – instead, try registering a user from the application or making an API call using Postman, so the /register route handler code that we added previously will be executed.
As you can see above, when you click on create new account button, you're automatically redirected to the code where you added the debugger; statement.
Now, you can debug the code line by line and see the values of each variable during debugging to find out and fix the issue.
How to Access Variables During Debugging
Sometimes when you mouse over any variable while debugging to see its actual value, the value might be too long (because it might be an object with many properties), so you can't see it easily by mousing over it.
In that case, while the debugger is still active, you can open the console tab and type the name of the variable whose value you want to see – as you can see in the below Gif:
So that's how you can easily debug any of your Node.js application's code.
How to Create a Script to Debug Node.js Apps
If you don't want to manually type the node inspect index.js command every time in the terminal, you can create a new debug script inside the package.json file like this:
"scripts": {
    "start": "node index.js",
    "debug": "node inspect index.js",
    "dev": "nodemon index.js"
},
So now, you can execute the npm run debug command to start your application in debug mode.
Quick Recap
To debug a Node.js application, you need to follow the below steps:
- Add a
debuggerstatement inside the code that you want to debug. - Run the
node inspect index.jsornode inspect server.jscommand to start the application in debug mode. - Access the URL
chrome://inspectin your Chrome browser. - Click on the
inspectlink under theRemote Targetsection. - Click on the blue triangle icon to skip debugging if you don't want to start debugging your application from the first line of the
index.jsorserver.jsfile. - Make an API call or do something that will trigger the code where you added the
debugger;statement. This way you can debug the code line by line and find out the issue.
Thanks for Reading
That's it for this tutorial. I hope you learned something new.
Want to watch the video version of this tutorial? You can check out this video.
If you want to master JavaScript, ES6+, React, and Node.js with easy-to-understand content, check out my YouTube channel. Don't forget to subscribe.
Want to stay up to date with regular content on JavaScript, React, and Node.js? Follow me on LinkedIn.